Most corporate procedures and work instructions suffer from a fatal flaw: passive voice and collective responsibility. Phrases like “The part is inspected” or “Production and Quality jointly ensure” are a ticking time bomb on the shop floor. When an IATF 16949 customer audit arrives or a critical complaint escalates, it turns out that nobody actually owns the step. How do you eliminate this “gray zone” once and for all? The answer is a properly constructed Swimlane Flowchart.
Why Traditional Text Procedures Fail in Audits
Quality Management System (QMS) auditors do not want to read dozens of pages of dense text where the key message gets lost. In a process audit (such as VDA 6.3), they care about three fundamental questions:
- What exactly happens in the process (step by step).
- Where decisions are made (e.g., part release vs. scrap disposal).
- Who holds the baton of accountability at any given moment.
When a process map lacks clearly defined roles, it breeds an alibi culture. The operator assumes the setter inspected the dimension. The setter assumes quality signed it off. And quality insists production already released the batch. The end result? A non-conforming part shipped directly to the OEM customer.
Flowcharts and Swimlanes: The Antidote to Manufacturing Chaos
A standard flowchart shows the sequential flow of activities. But to turn it into an audit-proof QMS document for IATF 16949, it must incorporate Swimlanes (plavecké dráhy / cross-functional lanes).
Picture a swimming pool divided into dedicated lanes. Each lane (column or row in the diagram) belongs to a single department, job role, or IT system. Every activity box, decision diamond, and output document is placed strictly inside the lane responsible for executing it.
Key Advantage for Automotive: Hand-Off Visualization
A Swimlane Flowchart instantly highlights Hand-offs (departmental handovers). Every arrow crossing from one lane to another (e.g., from Production to Quality) represents a transfer of responsibility and the single highest risk point for communication breakdown. Experienced auditors zero in on these lines first.
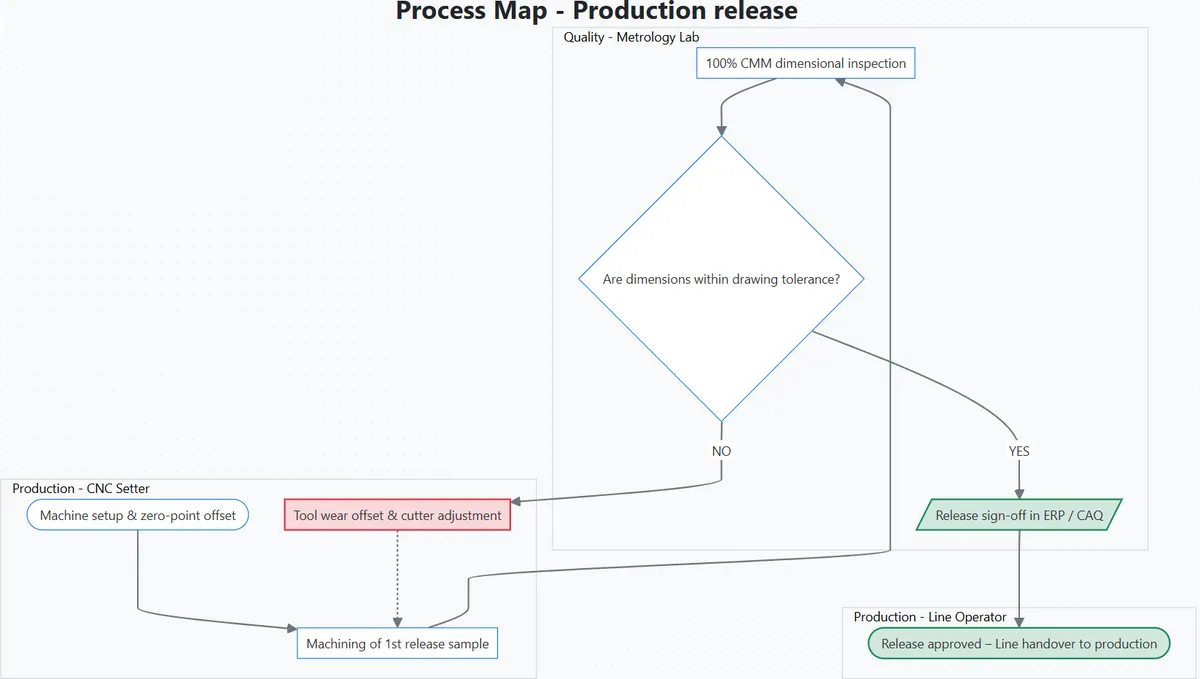
Shop Floor Example: First-Off Release on a CNC Machining Line
Consider how a production startup process looks when mapped into clear swimlanes. Once visualized, the workflow becomes airtight:
- Lane 1 (Production – CNC Setter): Sets up clamping fixtures, loads the NC program, and machines the first sample piece. Cleans it and delivers it with the routing sheet (Job Traveler) to the inspection room. (Arrow crosses into the next lane).
- Lane 2 (Metrology Lab – Quality): Receives the sample and performs 100% CMM 3D dimensional measurement. Next is the decision diamond: “Are dimensions within drawing tolerance?”.
- Branching Logic: If NO, a dotted rework loop returns to Lane 1 for tool wear offset adjustment, insert replacement, and sample re-machining. If YES, quality records the line release in the ERP / CAQ system. (Arrow transitions to the third lane).
- Lane 3 (Production – Line Operator): Sees the green release status in the ERP system and presses start for mass serial production.
How to Build a Swimlane Flowchart in Minutes
Drawing swimlane diagrams in PowerPoint or Excel is painful – add one step and you spend the afternoon nudging crooked arrows and misaligned boxes. Traditional BPMN tools are often overly complex and require expensive enterprise licensing.
That is why we developed the free Online Process Flowchart Editor on GetQualityTools.com.
The editor uses automated layout intelligence. You simply add your process steps (e.g., “Dimensional check”), select the node shape (rectangle, decision diamond), and enter the department name in the “Who? (Department)” field. The engine automatically calculates the swimlanes, groups nodes by role, and routes clean non-crossing arrows. With a single click, you download a sharp, publication-ready PDF for your ISO/IATF quality documentation.
Conclusion: Putting the Process Map into Action
Mapping the process is not the finish line – it is the foundation. Once your flowchart is approved and posted on the shop floor, you must routinely verify that the standard is followed:
- Audit the Standard: To verify that setters and operators adhere to the flowchart daily, conduct Layered Process Audits. Build your audit questionnaires in our free LPA Checklist Generator.
- Investigate Non-Conformities: If a customer defect slips through despite the standard, identify the exact flowchart node that failed and uncover the root cause using the 5-Why Analysis or Ishikawa Diagram.
- Lock in Corrective Actions: Package your containment and permanent corrective actions into an OEM-grade customer submission using our 8D Report Generator.